Read Time9 Minute, 25 Second
Contents
Introduction
Modern applications rely heavily on network connectivity between microservices, across accounts, and even across Regions. In the cloud, understanding how traffic flows within your Virtual Private Cloud (VPC) and between AWS services is crucial for performance, security, and cost management.
In this article, we’ll explore how developers can monitor, analyze, and troubleshoot network traffic in AWS using built-in tools like VPC Flow Logs, Reachability Analyzer, CloudWatch, and Traffic Mirroring, and how to apply these in real-world debugging scenarios.
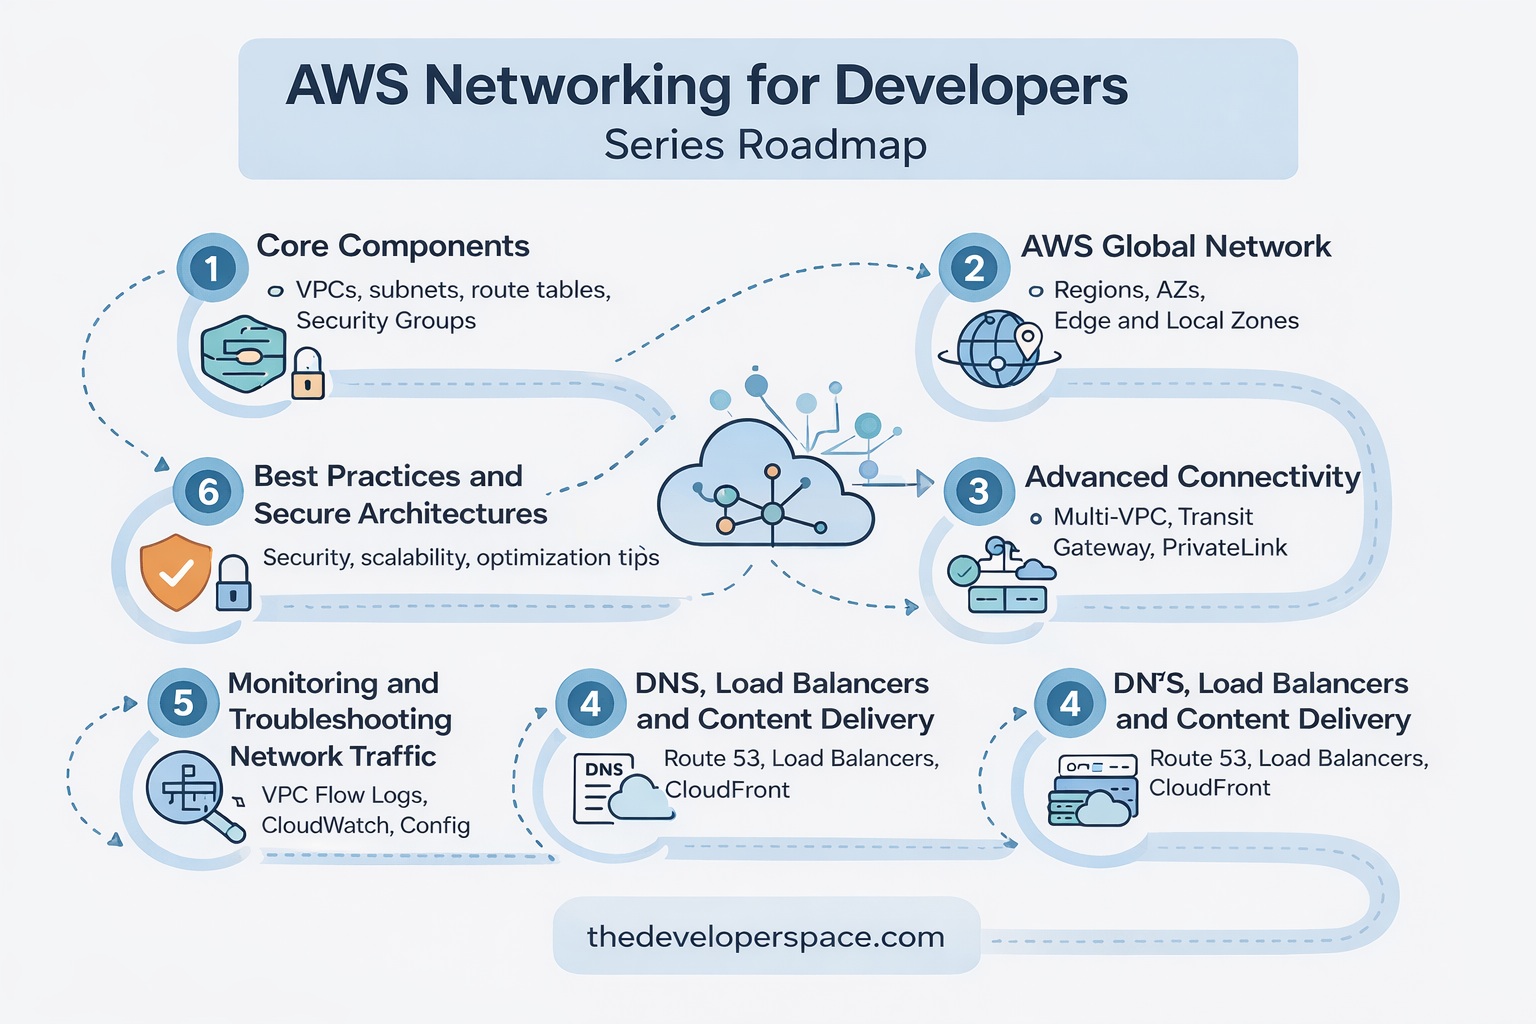
Articles in this series
Before reading this article, I recommend that you read the previous articles in this series to understand the basics of AWS Networking.
![]() AWS Networking for Developers: Part 1 – Core Components
AWS Networking for Developers: Part 1 – Core Components
![]() AWS Networking for Developers: Part 2 – AWS Global Network
AWS Networking for Developers: Part 2 – AWS Global Network
![]() AWS Networking for Developers: Part 3 – Advanced Connectivity
AWS Networking for Developers: Part 3 – Advanced Connectivity
![]() AWS Networking for Developers: Part 4 – DNS, Load Balancers and Content Delivery
AWS Networking for Developers: Part 4 – DNS, Load Balancers and Content Delivery
![]() AWS Networking for Developers: Part 5 – Monitoring and Troubleshooting Tools
AWS Networking for Developers: Part 5 – Monitoring and Troubleshooting Tools
![]() AWS Networking for Developers: Part 6 – Developer Best Practices
AWS Networking for Developers: Part 6 – Developer Best Practices
Understanding Why Network Visibility Matters
AWS provides several services and tools to monitor and troubleshoot network configurations and issues. When your app faces latency, timeout errors, or unexpected disconnections, the root cause often lies in the network path. But unlike on-premise systems, AWS networks are software-defined and abstracted, meaning traditional tools like packet sniffers don’t always apply.
Network monitoring in AWS enables developers to:
- Identify bottlenecks or misconfigurations in routing and security groups.
- Detect unauthorized traffic or potential intrusions.
- Measure latency and throughput for optimization.
- Trace issues between services, accounts, or Regions.
Core Tools for AWS Network Monitoring
Let’s dive into the key tools that give you visibility into your AWS network behavior.
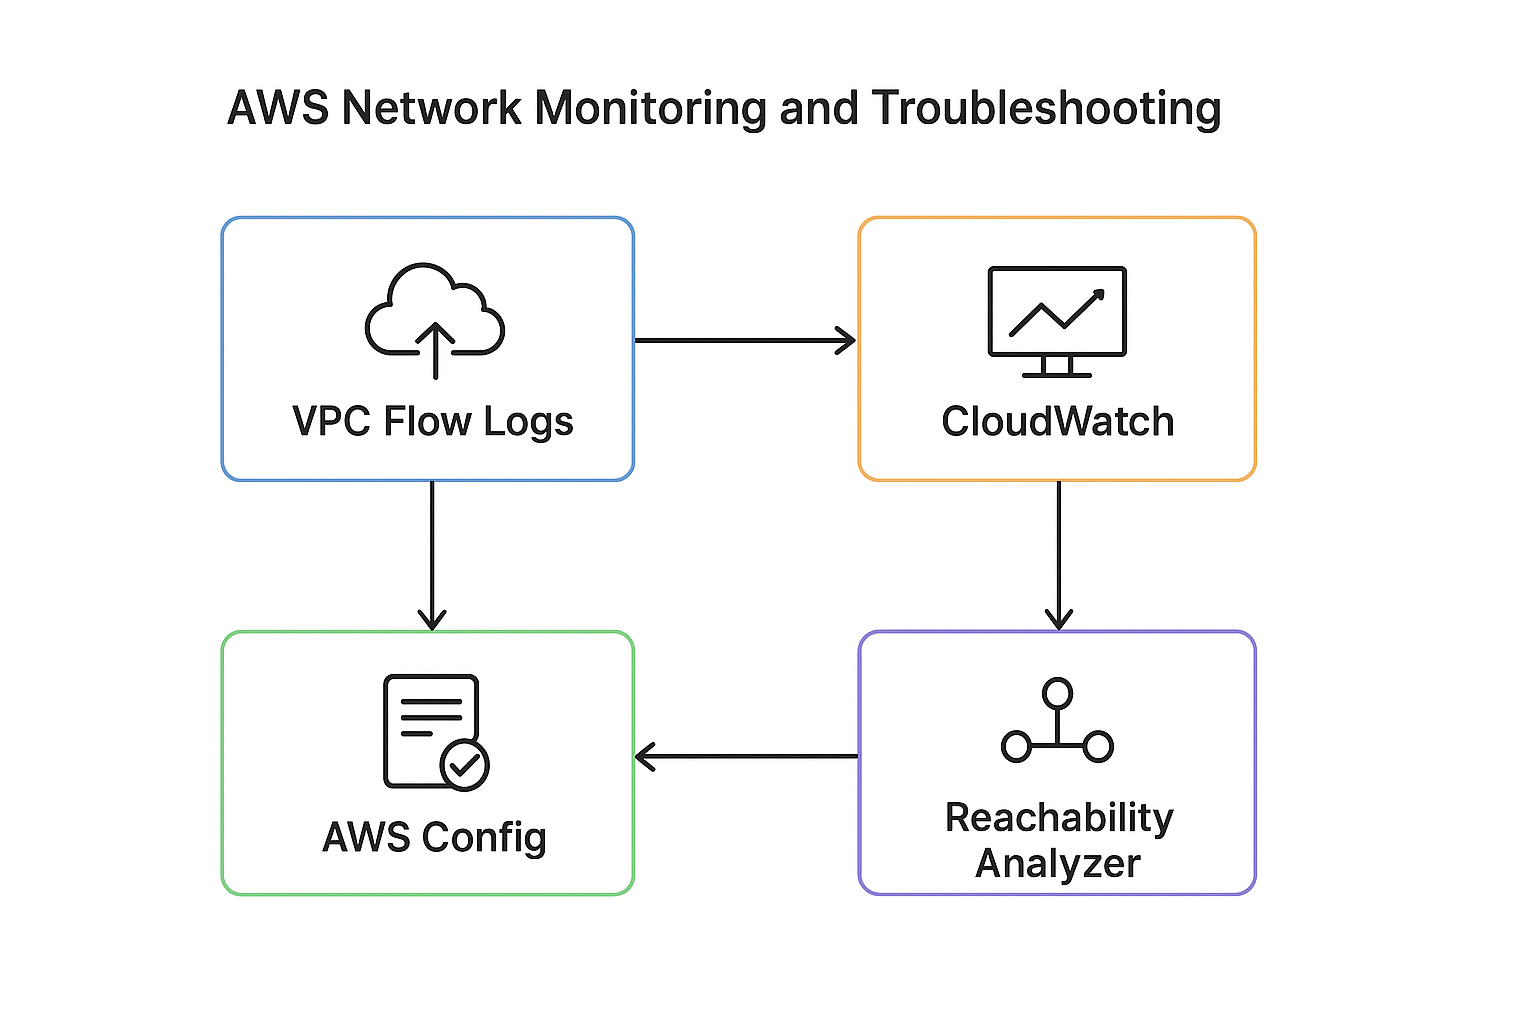
VPC Flow Logs
VPC Flow Logs capture information about the IP traffic going to and from network interfaces in your VPC. They help developers monitor traffic patterns, troubleshoot connectivity issues, and identify overly permissive or restrictive security rules. Logs are stored in Amazon CloudWatch Logs or S3, enabling filtering and analysis. This tool is invaluable for auditing and debugging both inter-service and client-to-service communications within your VPC.
Where it can be enabled:
- VPC level
- Subnet level
- Network Interface (ENI) level
Captured data includes:
- Source and destination IPs
- Ports and protocols
- Action (ACCEPT or REJECT)
- Traffic volume and timestamps
Where it helps developers:
- Debugging connectivity issues (e.g., rejected connections due to Security Group rules).
- Monitoring API or database access patterns.
- Identifying abnormal traffic (DDoS or port scanning).
Developer Examples:
1. If a Lambda function in a private subnet cannot reach DynamoDB, checking VPC Flow Logs for the ENI can quickly reveal if the traffic is being rejected by a route or security group.
2. If a service can’t reach an RDS database, VPC Flow Logs can reveal whether the traffic was dropped due to a missing security group rule or NACL block.
Reachability Analyzer
The Reachability Analyzer is an interactive tool that lets you test network paths between AWS resources like EC2 instances, ENIs, and VPC endpoints. It simulates a packet’s journey from source to destination, verifying if the path is reachable based on route tables, security groups, and network ACLs. For developers, it’s a quick and visual way to pinpoint why traffic might be failing, like a missing route or a misconfigured security group. It’s especially helpful in complex VPCs with multiple subnets, NAT gateways, or load balancers.
Developer Example:
When a new microservice deployment can’t reach an internal API, the Reachability Analyzer can instantly pinpoint if the traffic is blocked by a missing route or security rule.
AWS CloudWatch
Amazon CloudWatch is a centralized monitoring platform that collects metrics, logs, and events from AWS services and custom applications. For networking, developers can use CloudWatch to monitor metrics like data transfer volume, number of active connections on load balancers, NAT gateway throughput, and more. It supports alarms and dashboards, so developers can be alerted in real-time when unusual patterns occur, such as a spike in dropped packets or failed connection attempts. CloudWatch also integrates with VPC Flow Logs and ELB access logs, offering a unified view of network health and performance.
Developer Example:
You can create a CloudWatch alarm that triggers if network throughput on your ALB drops below a threshold, which is an early signal of upstream service failure.
AWS CloudTrail
CloudTrail logs all API activity across your AWS account, including actions that affect networking components like VPCs, security groups, route tables, and gateways. When developers need to investigate unintended changes, like a deleted route or modified NACL – CloudTrail provides a clear, timestamped record of who did what and when. It’s an essential tool for security auditing, compliance tracking, and root cause analysis in development and production environments alike.
AWS Config
AWS Config tracks configuration changes to AWS resources over time, allowing developers to see the historical states of networking components. It helps identify misconfigurations and provides compliance reports based on defined rules (e.g., ensuring all subnets have NACLs). For example, if a subnet suddenly becomes unreachable, AWS Config can show what changed and when, making it easier to roll back or correct the configuration. It’s especially useful in regulated environments or teams with strict infrastructure policies.
How AWS Config Helps with Network Monitoring and Troubleshooting
| Capability | What It Does | How It Helps Developers |
|---|---|---|
| Change Tracking | Records every configuration change to network components like VPCs, Subnets, Route Tables, Internet Gateways, NAT Gateways, NACLs, and Security Groups. | Quickly identify if a network outage started right after a route table update or security group change. |
| Configuration Timeline | Lets you view historical states of a resource. | Roll back to a known working configuration or compare network setups before and after a failure. |
| Rules and Compliance | Built-in and custom Config Rules evaluate resources against best practices (e.g., “Security groups should not allow 0.0.0.0/0 on port 22”). | Detect risky network configurations before they cause security incidents or outages. |
| Remediation | Automatically trigger AWS Systems Manager Automation or Lambda functions to fix non-compliant resources. | Automatically remove insecure security group rules or restore missing routes. |
| Cross-Region and Cross-Account Aggregation | Centralized view of configuration changes across accounts and Regions. | Useful for multi-account setups where network issues often stem from mismatched configurations. |
Practical Developer Scenarios
- Diagnosing “sudden” connectivity failures
Suppose a service suddenly cannot reach an internal API.- With AWS Config, you can open the configuration timeline of the route table or NAT Gateway and see that a route was deleted 10 minutes ago.
- You immediately have a root cause and a fix.
- Preventing accidental security exposures
- A developer accidentally opens port 22 (SSH) to
0.0.0.0/0. - AWS Config detects this via a managed rule (
restricted-ssh) and flags it as non-compliant. - You can even set up an auto-remediation action to revert the rule within seconds.
- A developer accidentally opens port 22 (SSH) to
- Auditing compliance over time
- During post-incident reviews, AWS Config’s change history helps teams see how the network evolved, who changed what, and how those changes impacted availability.
- Verifying network architecture drift
- Developers often deploy via IaC tools like CloudFormation or Terraform. AWS Config helps verify that your live network still matches your intended IaC template, highlighting drift or manual edits.
VPC Traffic Mirroring
Traffic Mirroring is an Amazon VPC feature that allows developers to capture and inspect actual packet-level traffic from ENIs (Elastic Network Interfaces), similar to a network tap in traditional data centers.
Why it’s useful:
- Deep packet analysis for debugging or security auditing
- Performance profiling for services with intermittent failures
- Integration with third-party monitoring tools (e.g., Wireshark, Zeek)
Developer insight:
This is particularly helpful when debugging low-level protocol issues (e.g., SSL/TLS handshake failures or intermittent TCP resets).
AWS Network Manager
Network Manager is a centralized tool that helps visualize and manage global networks built with Transit Gateways, VPNs, and Direct Connect. It is capable of:
- End-to-end network topology visualization
- Route analysis across Regions and accounts
- Monitoring link health and latency
Developer Use case:
In multi-account environments, Network Manager provides a clear view of inter-VPC and on-prem connectivity, reducing guesswork during outages.
Troubleshooting Common AWS Networking Issues
Here are some developer-friendly strategies to diagnose and fix network connectivity issues efficiently:
| Problem | Possible Cause | Developer Fix |
|---|---|---|
| EC2 cannot reach the internet | Missing or misconfigured Internet Gateway / route table | Verify that the route table points to the IGW and subnet is public |
| Private instance cannot access S3 | No NAT Gateway or VPC endpoint | Add a NAT Gateway or S3 VPC Endpoint |
| Service-to-service timeout | Security Group or NACL blocking port | Check VPC Flow Logs for REJECT entries |
| Cross-account VPC communication fails | Missing VPC peering or route | Validate peering connection and route propagation |
| DNS resolution fails | Custom DNS configuration | Check Route 53 Resolver or VPC DNS settings |
Developer Best Practices for Network Monitoring
- Enable VPC Flow Logs by default for every new VPC or subnet.
- Enable AWS Config in every Region – network resources can exist across multiple Regions, and missing one may hide part of the picture.
- Use structured log storage (e.g., send logs to CloudWatch Logs or S3 with Athena for queries).
- Correlate network and application metrics – latency in CloudWatch often maps directly to traffic patterns.
- Automate diagnostics – use AWS Config and Lambda functions to check for missing routes or bad Security Group rules.
- Monitor costs – excessive Flow Logs or Traffic Mirroring data can increase S3 and CloudWatch charges.
Wrapping Up
Monitoring and troubleshooting AWS network traffic is not just an operational task. It’s a developer’s superpower. By using tools like VPC Flow Logs, Reachability Analyzer, Traffic Mirroring, and CloudWatch, you can quickly move from guesswork to data-driven insights.
When you combine these with proactive alerting and automated diagnostics, you create self-healing, observable systems that keep your applications performant and secure, even at scale.
References
Logging IP traffic using VPC Flow Logs
What is Reachability Analyzer?
Useful documentation
[…] 🔗 https://thedeveloperspace.com/monitoring-and-troubleshooting-aws-network-traffic/ […]